Why Software Reporting Tools Matter for Business Growth
Discover why software reporting tools matter for business growth. Unlock real-time insights, enhance decision-making, and streamline operations.
June 3, 2026
Article

Software reporting tools are platforms that consolidate, automate, and govern business data so managers can access accurate, real-time insights for faster, more confident decisions. Understanding why software reporting tools matter starts with one fact: most businesses already have the data they need. The problem is that data sits in disconnected systems, spreadsheets, and siloed departments where no one can act on it quickly. Tools like Microsoft Fabric, Ronja, and ERP-integrated BI dashboards solve this by turning scattered records into a single, governed source of truth. The result is less time spent chasing numbers and more time running the business.
Why software reporting tools matter for data-driven decisions
Every mid-sized business runs on at least three or four separate systems. Sales data lives in a CRM. Job costs sit in an ERP. Payroll runs through a separate HR platform. Finance pulls from all of them, manually, every reporting cycle. This fragmentation is the root cause of slow decisions, reconciliation errors, and conflicting numbers across departments.
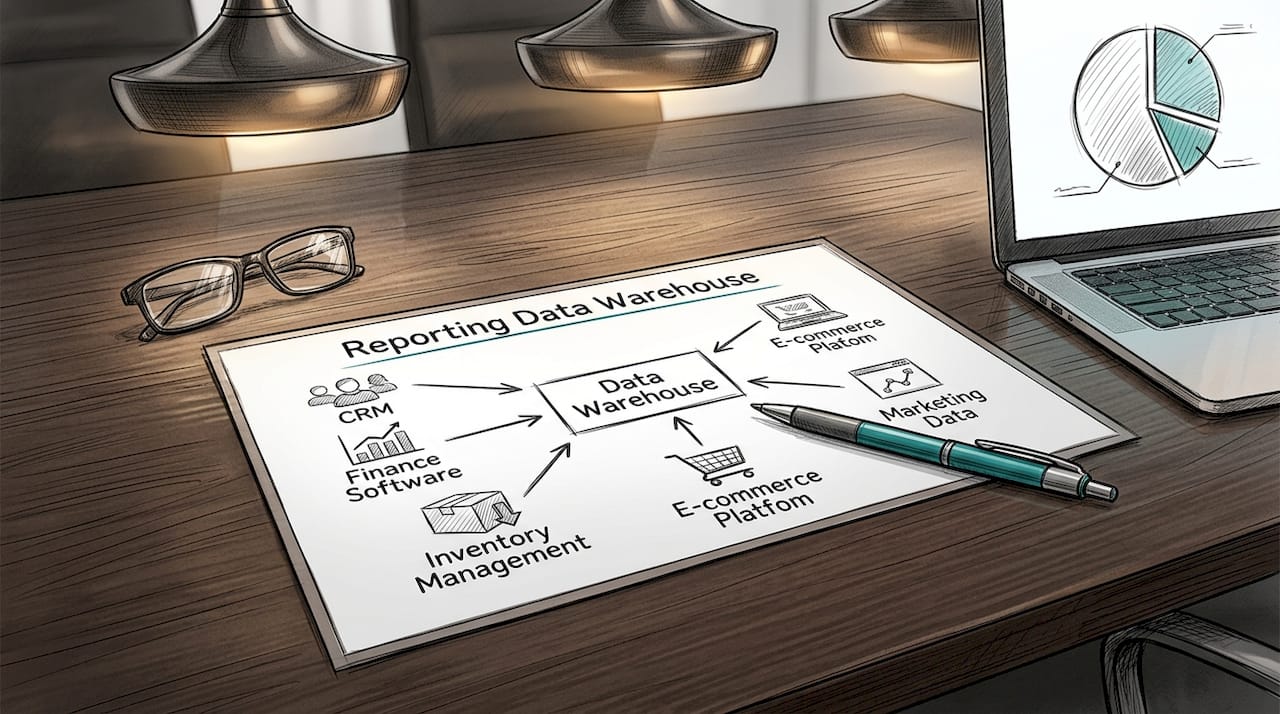
Software reporting tools solve this by creating a unified data foundation, often called a reporting data warehouse, that pulls from all source systems and applies consistent mapping, currency conversions, and intercompany eliminations automatically. Manual cross-system reporting is slow, error-prone, and non-repeatable without this architecture. That means every ad-hoc export your team runs today carries a real risk of producing results that cannot be replicated next month.
The business case for unification is concrete. Sonata Software moved to Microsoft Fabric for unified reporting and achieved a 25–30% reduction in reconciliation effort while accelerating business responsiveness by 30–40%. That is not a marginal improvement. It means finance teams spend fewer hours arguing about which spreadsheet is correct and more hours acting on what the numbers say.
The importance of reporting tools goes beyond speed. When every department queries the same governed data layer, you eliminate "versions of the truth." Revenue recognized by sales no longer conflicts with revenue booked by finance. Job costs reported by operations match what accounting closes at month-end.
- Unified data removes reconciliation disputes between departments
- Consistent metric definitions prevent conflicting reports
- A single data foundation supports trend analysis even through ERP migrations
- Reporting data warehouses preserve historical data when source systems change
Pro Tip: Centralize your metric logic in one governed layer before building dashboards. If "revenue" means different things in sales and finance, no dashboard will fix that. Define it once, enforce it everywhere.
How automation transforms reporting efficiency
Manual reporting follows a predictable and costly pattern. A finance analyst exports data from three systems, pastes it into Excel, applies formulas, checks for errors, formats the output, and sends it up the chain. That process takes days. By the time leadership sees the numbers, the data is already stale.
Automated reporting tools flip this entirely. Automated financial reporting shifts the typical time allocation from 70–80% data preparation and 20–30% analysis to the reverse, reclaiming 36–60 days of analyst time annually. That is a full two months of capacity returned to your team every year, redirected from formatting spreadsheets to interpreting results.
The distinction between a BI dashboard and true automation matters here. A BI dashboard displays data. Automated reporting produces governed reports by connecting directly to source systems, applying business rules, and generating outputs without manual data engineering. A BI dashboard is not automation on its own. Finance teams that rely on dashboards fed by manual exports still face the same delays and inconsistencies they had before.
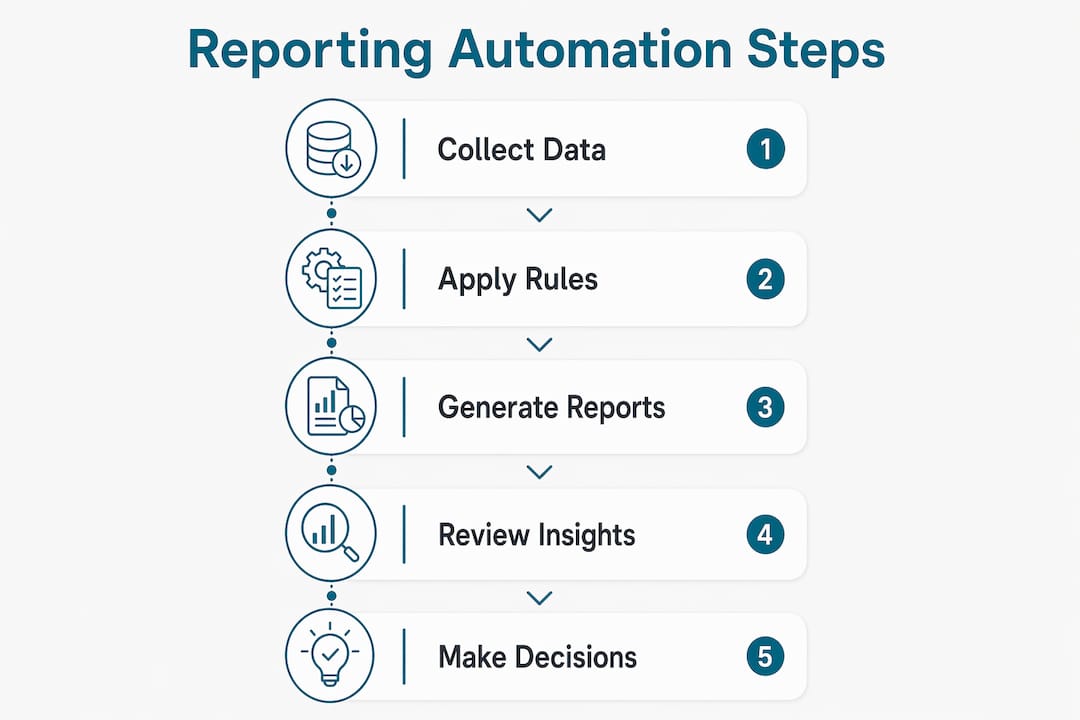
Here is what automated reporting actually delivers in practice:
| Capability | Manual Reporting | Automated Reporting |
|---|---|---|
| Data collection | Manual exports from each system | Direct source connections |
| Business rule application | Analyst applies formulas per cycle | Governed rules applied centrally |
| Report generation | Hours to days per cycle | Minutes, on schedule |
| Error risk | High, varies by analyst | Low, consistent logic |
| Time for analysis | 20–30% of reporting cycle | 70–80% of reporting cycle |
| Natural language queries | Not available | Supported in modern platforms |
- Continuous data syncing replaces batch exports
- Governed business rules apply uniformly across all reports
- Natural language query support lets non-technical managers pull their own data
- Scheduled report delivery removes manual distribution steps
Pro Tip: Before selecting a reporting tool, map how many hours your team spends on data prep each month. Multiply by 12. That number is your baseline ROI target. Any tool that cannot beat it in time savings within year one is not the right fit.
Why governance and auditability are non-negotiable
Reporting tools that produce fast outputs but cannot explain how they got there create a different kind of problem. When a board member questions a revenue figure or an auditor requests a data trail, "the system calculated it" is not an acceptable answer.
Governance in reporting means every metric has a defined owner, a documented calculation method, and a traceable path from source data to final output. Audit trail capabilities in platforms like Oracle Essbase allow teams to export logs, track data-value changes, and link reporting objects back to their source. This level of traceability supports compliance requirements and reduces the risk that comes from manual, undocumented processes.
The semantic layer is the governance mechanism that most businesses overlook. A semantic layer sits between your raw data and your reports, translating database fields into business terms and applying consistent rules. Consistent metric definitions via a semantic layer mean the same query produces the same answer whether a sales manager or a CFO runs it. Without this, two people asking the same question get two different numbers, and trust in the reporting system collapses.
Poor governance also creates compliance exposure. Financial reporting in regulated industries requires documented audit trails, controlled access, and version history. Operational reporting for field service businesses requires accurate job cost data that ties back to dispatched work orders and invoiced amounts.
- Define metric ownership before deploying any reporting tool
- Document calculation logic in a central semantic layer
- Require audit log export capability from any platform you evaluate
- Control access by role so report consumers cannot alter underlying data
Pro Tip: Align your report refresh frequency with your actual decision cadence. If your leadership team reviews performance weekly, daily refreshes add cost without value. If you close monthly, near-real-time data is overkill for most metrics. Match the tool to the rhythm of your management process.
How reporting tools connect strategy to execution
Reporting tools are not just operational utilities. They are the mechanism that connects your strategic goals to daily management decisions. Without this connection, KPIs become decorative numbers that no one acts on.
The Balanced Scorecard Institute frames this clearly: digitally executed strategy reporting prevents drift and strengthens decision confidence by connecting objectives, KPIs, initiatives, and accountability in one system. When strategy lives in a slide deck and reporting lives in a spreadsheet, the two never meet. Managers make decisions based on what they can measure, not what the strategy requires.
Integrated reporting tools change this by making strategy visible at every level of the organization. A field service business owner can see whether technician utilization rates are tracking against the annual growth target. A finance manager can see whether job margins are holding against the pricing strategy set at the start of the year. These are not abstract metrics. They are the signals that tell you whether your business is executing or drifting.
The risk, as the Balanced Scorecard Institute notes, is that bad strategy discipline digitized is still bad strategy discipline. Software amplifies the effectiveness of a strong management process. It does not create one. Before investing in reporting tools, verify that your team has clear owners for each KPI, defined targets, and a regular cadence for reviewing performance against plan.
The benefits of connecting reporting to strategy execution include:
- Clear ownership of KPIs at the individual and team level
- Visible links between daily operational metrics and annual goals
- Faster identification of performance gaps before they compound
- Management conversations grounded in shared, trusted data rather than competing spreadsheets
- Accountability structures that reporting tools can track and surface automatically
When you use your software selection checklist to evaluate platforms, include strategy linkage as a requirement. A tool that tracks job completions but cannot connect them to revenue targets or customer retention goals is solving only half the problem.
Key takeaways
Software reporting tools deliver their highest value when data is unified, automated, governed, and connected to strategic execution rather than used as standalone dashboards.
| Point | Details |
|---|---|
| Unify before you visualize | Consolidate data from all source systems into one governed layer before building reports or dashboards. |
| Automation reclaims analyst time | Automated reporting can return 36–60 days of analyst capacity annually by eliminating manual data prep. |
| Governance builds trust | Consistent metric definitions and audit trails are required for reports that leadership and auditors can rely on. |
| Strategy linkage drives accountability | Reporting tools that connect KPIs to initiatives and owners prevent strategy drift and improve execution. |
| Match refresh rate to decisions | Align data update frequency with your management cadence to avoid unnecessary cost and complexity. |
What I've learned about reporting tools after working with field service businesses
Most business owners I work with come to Ampleexpress asking for a better dashboard. What they actually need is better data. The two are not the same thing, and confusing them is the most common and expensive mistake in software selection.
The businesses that get the most out of reporting tools are the ones that do the unglamorous work first. They define what "job margin" means before they buy a platform. They map which systems hold which data before they ask a vendor for a demo. They identify who owns each KPI before they configure a single report. That preparation is what separates a reporting tool that transforms operations from one that collects dust after the first quarter.
I have also seen the opposite. A contractor invests in a well-regarded BI platform, spends three months on implementation, and ends up with beautiful charts that no one trusts because the underlying data was never reconciled. The tool was not the problem. The process was.
The software ROI calculation for reporting tools is straightforward when you measure the right things: hours saved on data prep, reduction in reconciliation disputes, and speed from data to decision. If you cannot measure those three things before you buy, you will not be able to prove value after.
My honest advice: fix your metric definitions first, then automate, then visualize. In that order.
— Blake
See how Ampleexpress matches you with the right reporting solution
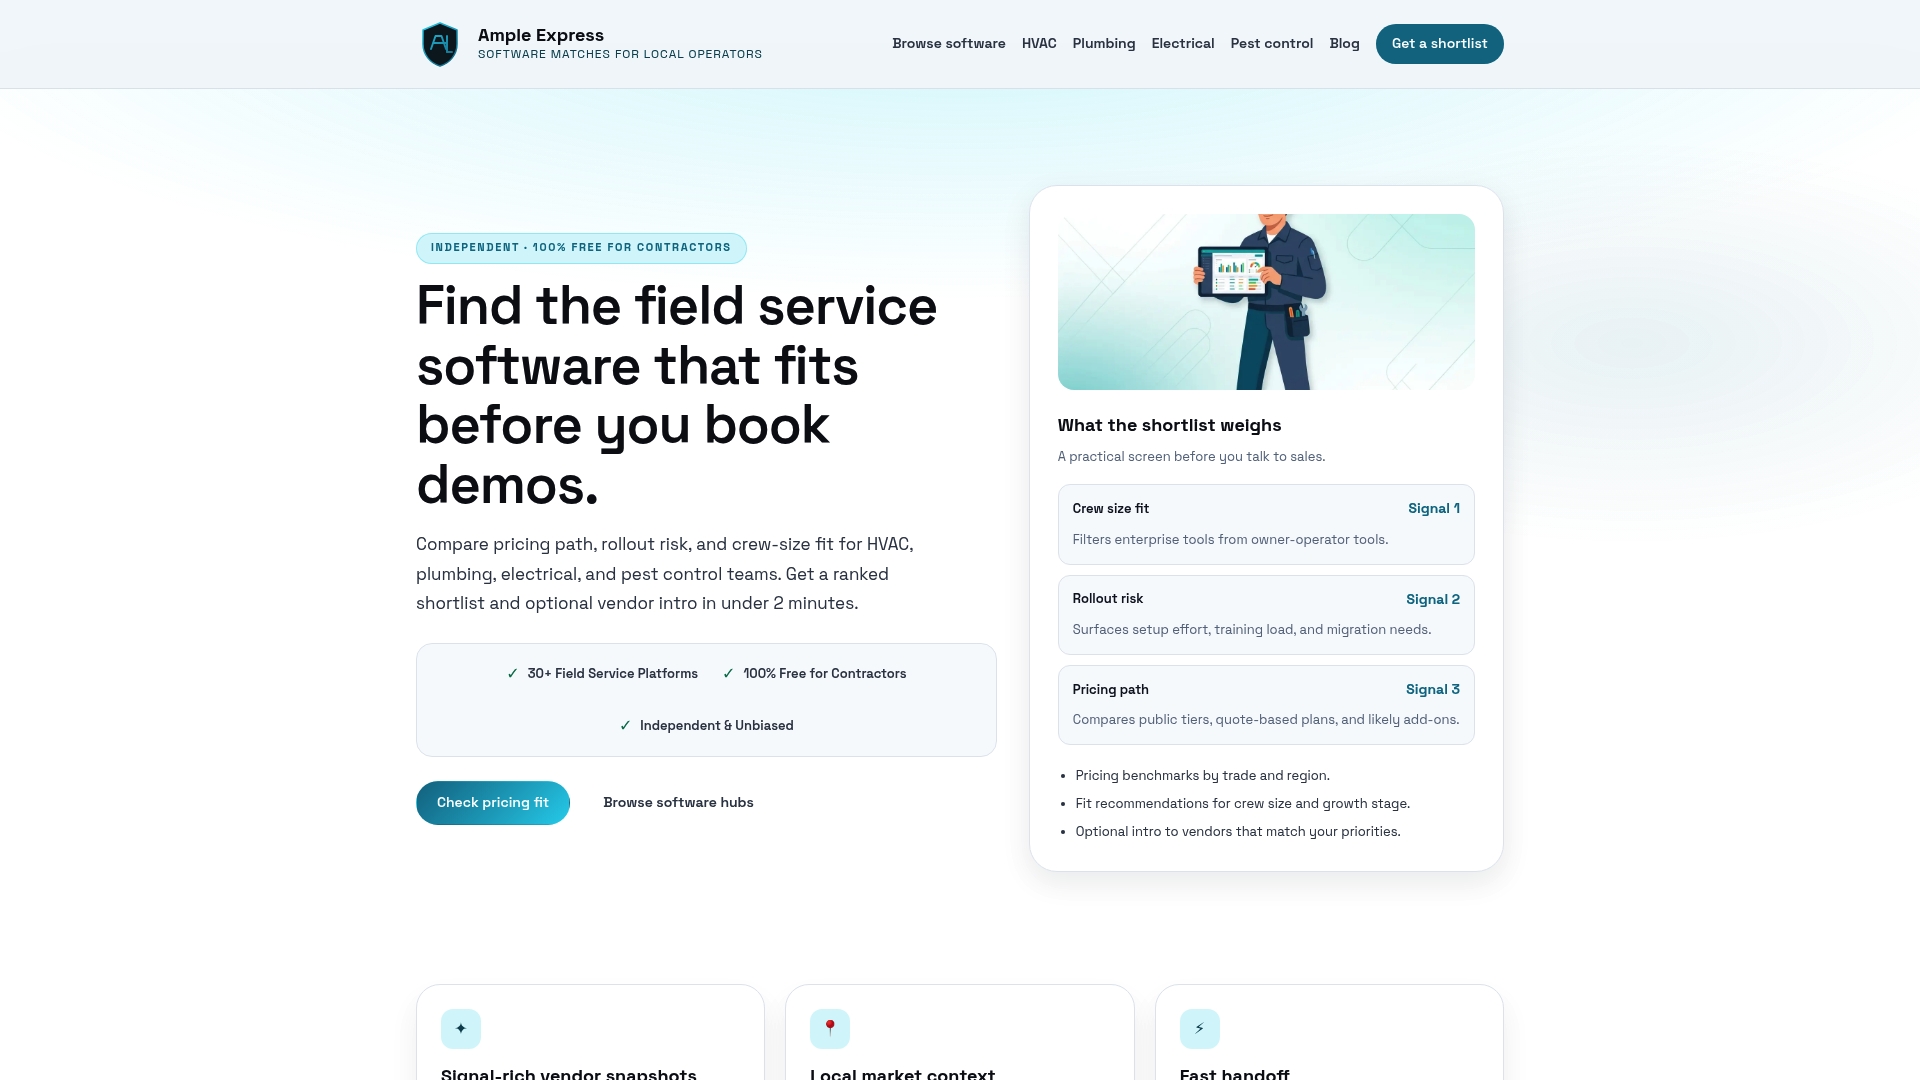
Ampleexpress works with HVAC, plumbing, electrical, and pest control contractors to identify software that fits their crew size, operational complexity, and reporting needs. The platform evaluates over 30 field service software options and ranks them by pricing path, rollout risk, and fit. If your team is spending hours each week pulling data manually or reconciling job costs across systems, that is a solvable problem. Share your crew size and priorities with Ampleexpress and receive a ranked shortlist of tools built for your trade, your market, and your management process. Intelligent document automation tools like Docupow AI can also complement your reporting setup by reducing manual data entry at the source.
FAQ
What are software reporting tools?
Software reporting tools are platforms that collect data from multiple business systems, apply governed business rules, and generate structured reports for operational and financial decision-making. They range from ERP-integrated modules to standalone BI platforms like Microsoft Fabric.
How do reporting tools improve efficiency?
Automated reporting tools shift finance teams from spending 70–80% of their time on data preparation to spending that same proportion on analysis, reclaiming up to 60 days of capacity annually. They do this by connecting directly to source systems and applying business rules without manual intervention.
Why is data governance important in reporting software?
Governance ensures that every metric has a consistent definition, a traceable calculation path, and an audit trail. Without it, two users asking the same question get different answers, which destroys trust in the reporting system and creates compliance risk.
What is the difference between a BI dashboard and automated reporting?
A BI dashboard displays data that has already been prepared. Automated reporting connects to source systems, applies business rules, and generates reports without manual data engineering. Dashboards fed by manual exports still carry the same delays and errors as fully manual processes.
How do I choose the right reporting tool for my business?
Start by mapping your data sources, defining your key metrics, and identifying your decision cadence. Then evaluate tools on data unification capability, governance features, audit trail support, and how well they connect operational metrics to strategic KPIs. Ampleexpress provides a ranked shortlist based on these criteria for field service businesses.
Recommended
- Pest Control field service software
- Get a Pest Control software shortlist
- Contractor Software Selection Checklist for 2026 | Ample Express
- Software Pricing Benchmarks for Service Businesses (2026)
- Plumbing Software ROI Calculation Guide for Contractors
- austin Plumbing software guide | Ample Express